Model your mobile game's players and revenue before you spend on UA.
A Windows desktop simulator for retention, free and paid installs, reinvestment and multi-game portfolios. You set the assumptions; it shows what they add up to, and how far that could move.
Windows 10 or 11 · Works offline · Editable files included
What It Does
Cohorts and retention
Every install wave becomes a cohort that decays along an eight-point retention curve you set (days 1, 7, 30, 60, 90, 120, 160, 180).
Free and paid installs
Set free installs and a paid budget, then reinvest a percentage of revenue into more paid installs.
Paid channels
Split the paid budget across up to three markets, each with its own cost per install and its own retention scale.
Ads, purchases and subscriptions
Ad revenue per user, in-app purchase revenue per user, and subscriptions, each with the right cut taken out.
Real-world costs
Revenue cut, running costs, one-time dev cost, studio overhead, ad-network warm-up, ARPDAU drift, seasonality, CPI that rises with spend, and tax with or without loss carry-forward.
Many games, one timeline
Stagger launch days and cross-promote between games, with a weight and a cap per game, and optional chaining.
Range analysis
Re-run the whole portfolio 200 times with your inputs nudged within spreads you set, and see the low, middle and high outcomes.
Plain results
DAU, revenue against costs, breakeven day, return on spend, monthly revenue and take-home profit, in eight currencies.
Real Example Output
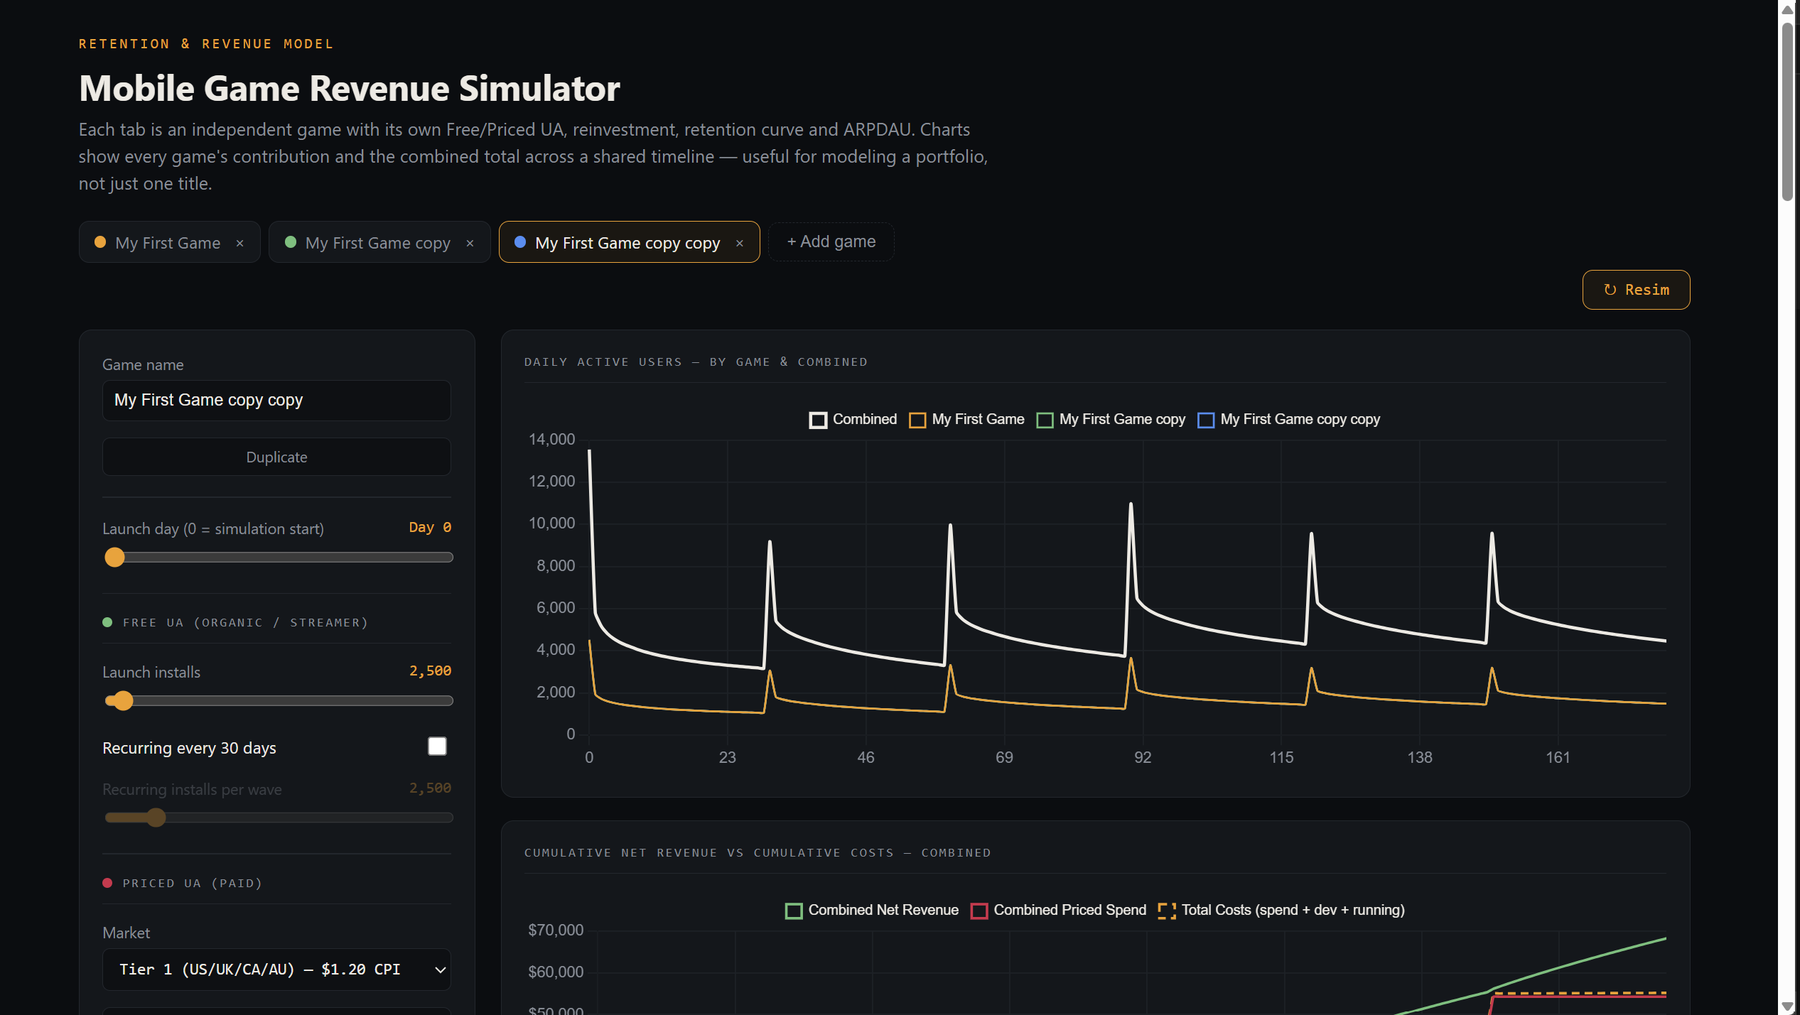
One run of the current app, shown exactly as it came out: with the starting values, with every realism setting off, and through the range analysis.
| Result after 180 days | Starting values | Every realism setting off |
|---|---|---|
| Net revenue | $55,574 | $113,865 |
| Paid UA spend | $46,862 | $77,689 |
| Dev and running costs | $750 | $0 |
| Net profit before tax | $7,961 | $36,176 |
| Breakeven day | Day 58 | Day 19 |
| Daily active users on day 180 | 4,389 | 10,687 |
Settings: Three copies of a game launching on day 0, day 30 and day 60, with the app's starting values, no cross-promo, 180 days, in US dollars. Each game starts with 2,500 free installs and a $3,000 paid launch wave (Tier 1 market, $1.20 CPI), reinvests 100% of net revenue for 3 months and then 60%, and earns $0.085 per user per day before the realism settings.
The same run, with the range analysis
Retention ±15%, revenue per user ±25%, CPI ±25%, free installs ±40%, one shared swing for all games, 200 seeded runs.
| After 180 days | Low (1 run in 10 below) | Middle | High (1 run in 10 above) |
|---|---|---|---|
| Net revenue | $34,866 | $54,072 | $86,631 |
| Net profit before tax | $441 | $7,550 | $20,016 |
| Daily active users on day 180 | 2,883 | 4,214 | 6,954 |
| Breakeven day (runs that break even) | Day 21 | Day 58 | Day 173 |
Profitable in 92% of the 200 runs; broke even within the window in 92%.
Example output under the app's starting values, which are rough estimates. Not a forecast. The right-hand column of the first table shows the same three games with every realism setting switched off. The range table shows how far the answer moves when four inputs are uncertain by the stated amounts; the percentages describe those runs, not the real world.


In this example the starting values cut net profit by about 78%, and the range runs from roughly break-even to more than double. The tool is only as good as your inputs.
See It Work
How It Works
Set your assumptions
Installs, budget, markets, revenue per user, retention and costs.
Watch it update
The charts and tables update as you move the sliders.
Test how fragile it is
Duplicate a game tab to compare cases, then run the range analysis to see how far the answer moves.
The arithmetic is exact and you can check it by hand. The result is only as good as the retention, revenue and CPI numbers you put in, and the starting values are rough estimates. Read the full limits →
Change markets, defaults, currencies and seasonality in a plain text file, or edit the model itself, for your own use. Source included. Customize and extend →
Who It's For
NOT FOR
One Price, Once
Mobile Game Revenue Simulator
The portable app, the editable settings, look and model files, an editing guide, the license, and the full source project. Single business, internal use.
One business, for its own internal use. Edit the files for your own use inside your own business. You may not sell, share or publish the app or your modified version, build a competing product from it, run it for clients or other businesses, or use it to train AI models. Read the license
The app isn't code-signed, so Windows SmartScreen warns you on first launch. Choose More info, then Run anyway.
Questions
Does it need the internet?
No. The charts library is bundled and the app runs offline. The one exception is an optional Fetch current rates button for exchange rates, which contacts an exchange-rate service only when you press it.
How accurate is it?
The math is exact and you can check it by hand. Forecasts depend on your assumptions and have not been validated against live games. The starting values are rough estimates. The range analysis shows how far the result moves if your inputs are off by amounts you choose. See Accuracy and limits.
What does the range analysis tell me?
It re-runs your portfolio 200 times with four inputs (retention, revenue per user, CPI and free installs) nudged within the spreads you set, and shows the low, middle and high results. It measures how sensitive your plan is to those guesses. It is not a probability of success in the real world.
Can I save my scenarios?
Not in version 1.0, and there's no export yet; closing the app clears your inputs. You can set your own starting values in config.js so new games open with your base case.
Can I resell it, share it, or run it for my clients?
No. The license covers one business, for its own internal use. Each client business needs its own license. Selling, sharing, publishing or building a competing product from it is not allowed. See the license.
See what your assumptions add up to.
And how far they could move, before you spend a dollar on UA.
Get Mobile Game Revenue Simulator