
▮▮▮ What it does
Every control, every result
A Windows desktop app that simulates how many players a mobile game keeps and the revenue they generate, given the installs, budget and reinvestment rules you choose.
What You Control
| Feature | What you set | What the model does with it |
|---|---|---|
| Games | Add, rename, duplicate or remove game tabs; a launch day for each | Each game runs on one shared timeline and shows zero before its launch day |
| Free installs | Launch installs (slider to 100,000); optional recurring installs every 30 days (slider to 20,000) | Costs nothing; each wave becomes its own cohort |
| Paid installs | An initial spend and a market preset with its CPI, or a custom CPI | Installs = spend ÷ CPI for that wave |
| Paid channels | Up to three channels, each with a market (or custom CPI), a share of the paid budget and a retention scale | Every paid wave is split across channels by share; each channel's users retain at its own scale |
| Reinvestment | A push percentage for N months, then a sustain percentage that continues | Every 30 days, spends that share of the previous 30 days' net revenue on a new paid wave |
| Retention | Percent still active on day 1, 7, 30, 60, 90, 120, 160 and 180 | Smooth curve between points; held flat after day 180 |
| Paid-install retention | A second set of the same eight points | Installs bought with paid UA use this curve; free, organic and cross-promo installs use the main one |
| Ad revenue | ARPDAU, meaning ad revenue per daily active user | Daily ad revenue = active users × ARPDAU, adjusted by the options below |
| In-app purchases and subscriptions | Purchase revenue per daily user; subscriber share and monthly price; a store fee | Added to revenue per user; the store fee comes out of purchases and subscriptions |
| Revenue cut | A percentage | Removes that share of ad revenue before anything else; reinvestment is taken from what's left |
| Costs | Running cost per month; one-time dev or launch cost per game; studio overhead per month for the whole portfolio | Charged from launch (overhead from day 0); included in breakeven, profit and the cost chart |
| Ad-network warm-up | A starting percentage and a number of days | Ad revenue per user starts at that share of full and climbs to 100% |
| ARPDAU drift | A percentage per 30 days | Ad revenue per user ramps up or decays over time |
| Seasonality | A built-in shape or 12 custom monthly multipliers for ad revenue and for CPI; the calendar month the simulation starts in | Multiplies ad revenue and CPI by month |
| CPI scaling | A percentage per doubling, counted from a spend you choose | Large paid waves cost more per install |
| Cross-promo | A preset from None to Very Aggressive, or a custom percentage; per game, a share-received weight and a cap on installs absorbed per 30 days; an optional chaining switch | Sends a share of each game's users to the other launched games as free installs, split by weight and capped |
| Tax | A rate, and a method: flat on total profit, or month by month with losses carried forward | Estimated on profit; never on a loss |
| Currency | Eight currencies; rates editable in the app, set in the settings file, or fetched on demand | Changes what you see and type; results don't change |
| Range analysis | Spreads for retention, revenue per user, CPI and free installs; whether games share one swing | Runs the portfolio 200 times with seeded random nudges and summarizes the spread |
| Timeline | Simulation length, 30 to 360 days | Shared by all games |
Slider limits, market presets and starting values are all editable in a settings file (Customize and extend).
What You See
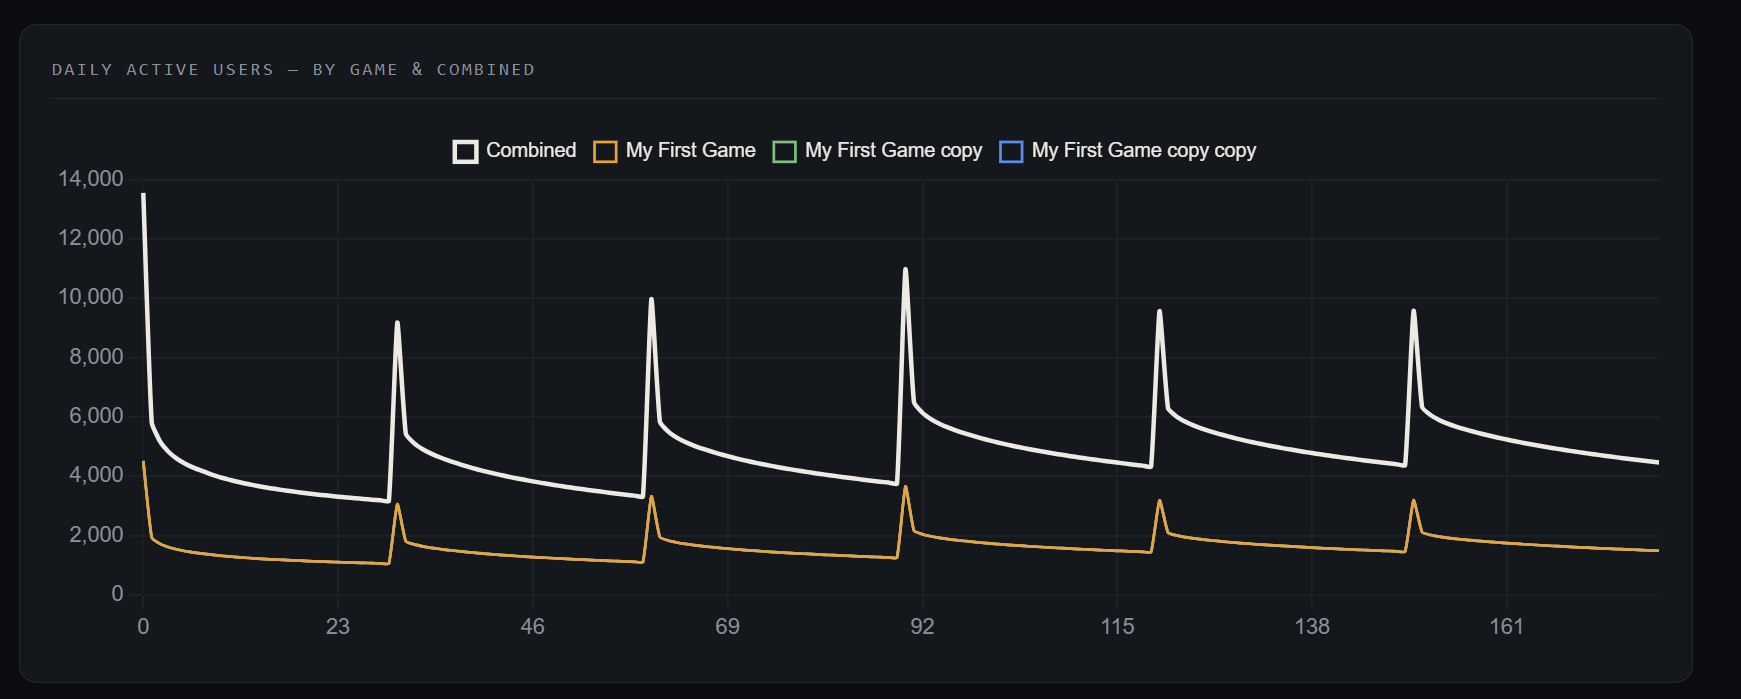
- A daily active users chart for every game, plus the combined total
- Cumulative net revenue against cumulative costs
- Headline cards: end DAU, net revenue, paid spend, dev, running and overhead costs, breakeven day (the first day net revenue covers all costs), net profit before tax, profit after tax, free installs and paid installs
- A per-game table: end DAU, net revenue, spend, return on spend, average paid CPI and cross-promo installs received
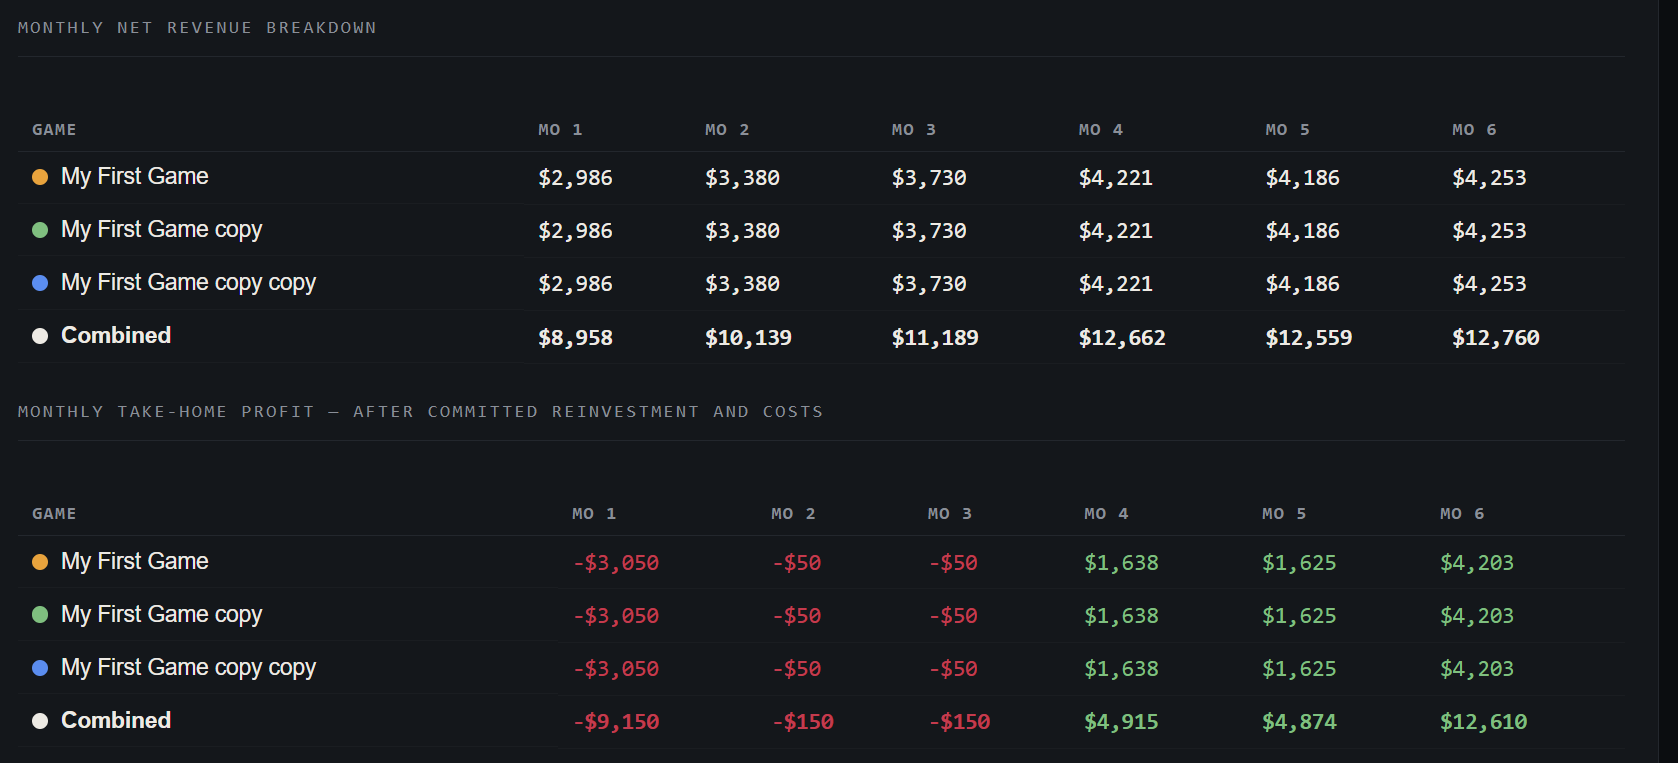
- A monthly net revenue table by 30-day month, with a combined row
- A monthly take-home table: net revenue minus the money already committed to the next paid wave, minus dev and running costs, with a studio-overhead row and a combined row
- A range analysis panel: low, middle and high results, the share of runs that are profitable and that break even, and a profit-range chart
- A Resim button that recalculates everything


Not in Version 1.0
No saving or exporting yet.
Closing the app clears your inputs. Also not included: per-player purchase funnels (conversion rate, timing, spend per payer), revenue per user that differs by country, and Mac, Linux or mobile versions. Accuracy and limits lists what the model leaves out.